Setting Up Performance Data Collection
Setting Up Virtual Machine Monitoring
Configuration
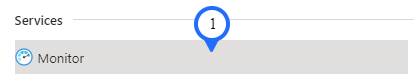
Step 1: Search for “Monitor” in Azure Portal.
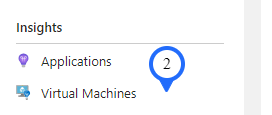
Step 2: Click on the “Virtual machine” under Insights tab.
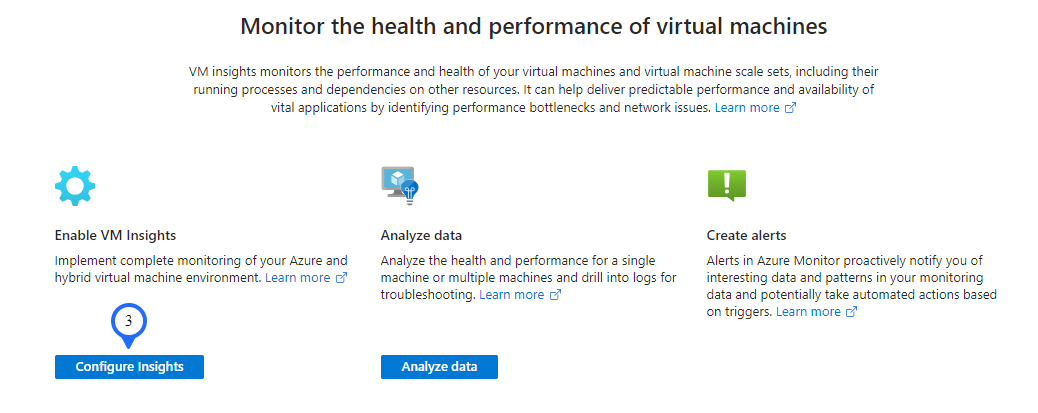
Step 3: Click on “Configure Insights”.
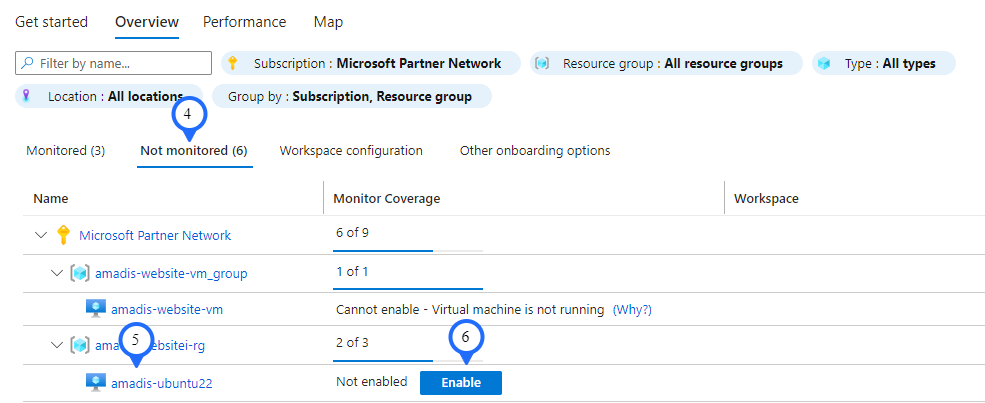
Step 4: Click “Not monitored” under 'Overview' tab in the right side.
Step 5: Choose the virtual machine which need to be enabled.
Step 6: Click on "Enable".
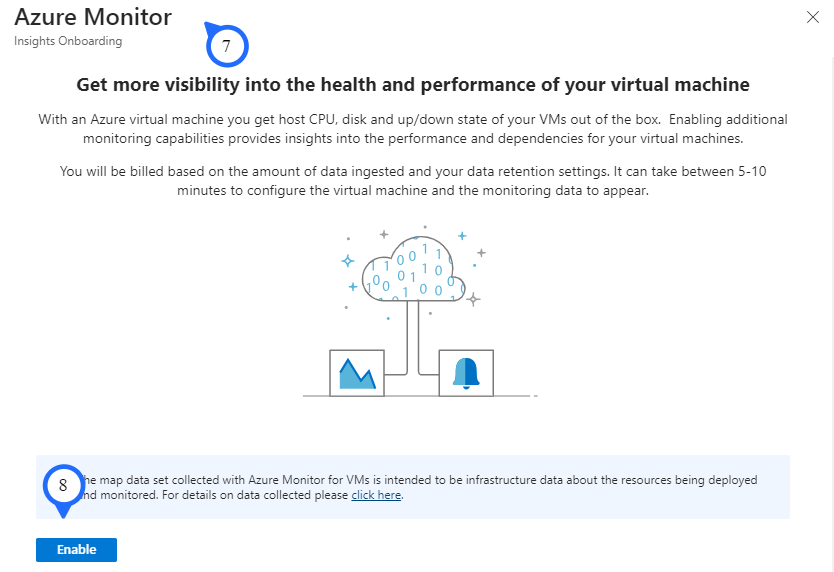
Step 7: It is redirected to the 'Azure Monitor Screen'.
Step 8: Click on "Enable".
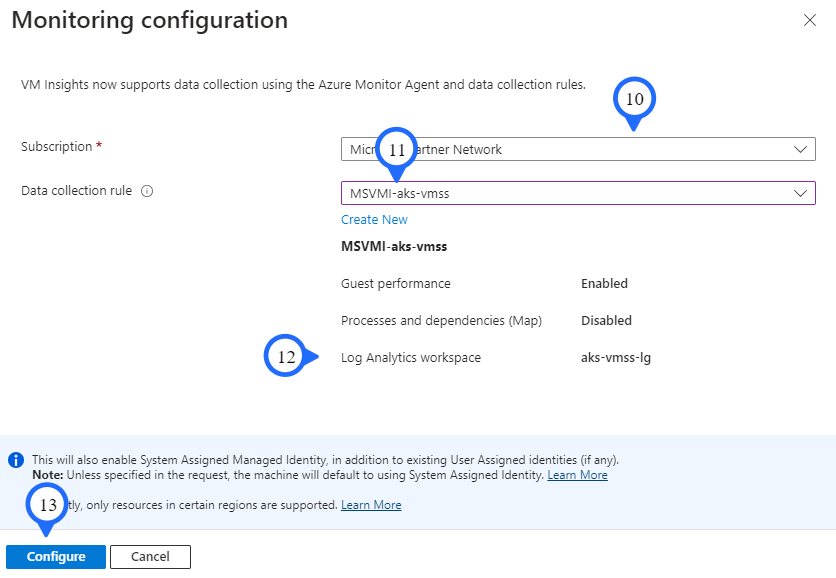
Step 9: It will redirect to the 'Monitoring Configuration' screen.
Step 10: Choose the required subscription.
Step 11: Choose the DCR which was created during the managed app creation from dropdown.
Step 12: The 'Log Analytics workspace' from the selected DCR location will get auto selected.
Step 13: Click on "Configure".
Step 14: Now the selected Virtual Machine is configured with the selected DCR. Repeat the steps from 5 to 13, for enabling all VM under "not Monitoring" tab.
Add Resources for monitoring (OPTIONAL)
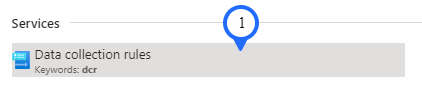
Step 1: Search for "Data collection rules" in azure portal.
Step 2: You can see the created DCR with enabled VM insights and performance counters.

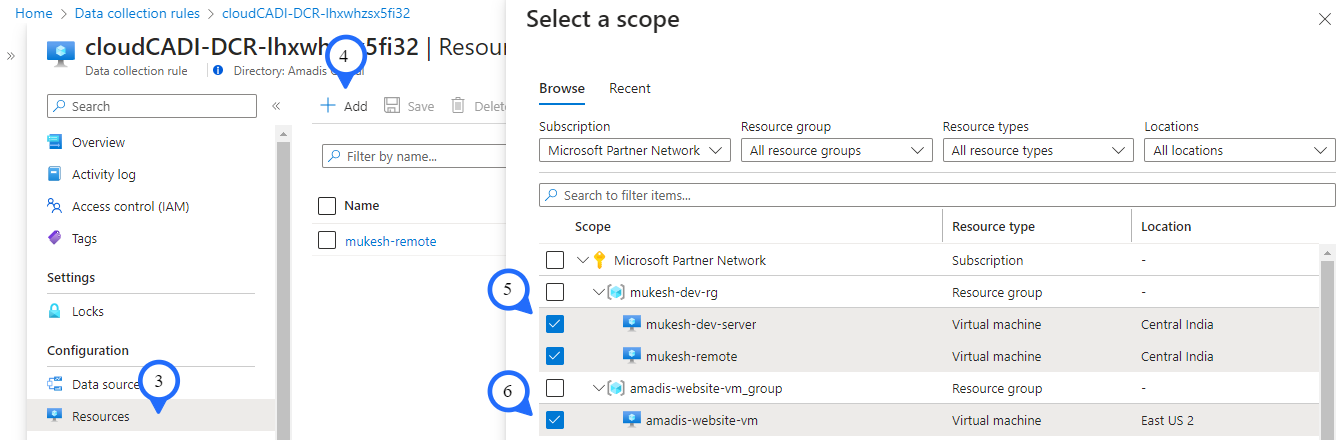
Step 3: To add VM in DCR, select the DCR and select the resources.
Step 4: Click “+ Add”, in the “Select a scope” section.
Step 5: Choose the resources need to add. Can add any number of resource we want.
Step 6: Click “Apply”.
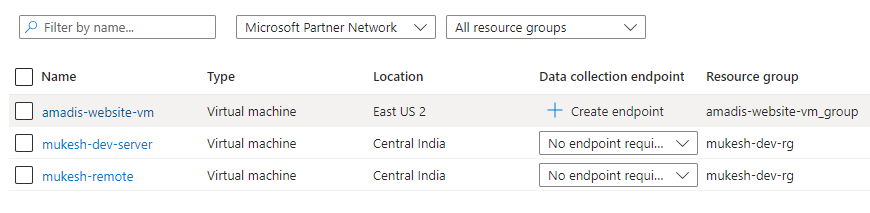
Step 7:. After adding the resource, it will be shown in the resource list . Logs of these resources will be sent to the selected log analytics workspace.
Add more Log Analytics Workspace to DCR (OPTIONAL)
Step 1: Search for "Data Collection Rules (DCR)" in azure portal.
Step 2: Choose the 'DCR' which needs to add new log analytics workspace.
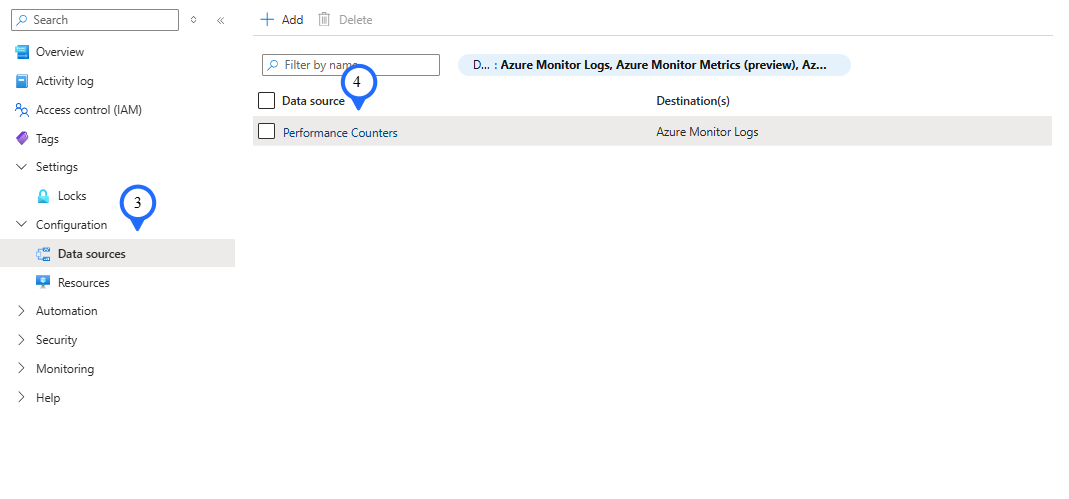
Step 3: Click on the "Data source" under Configuration tab.
Step 4: Click on "Performance Counters".
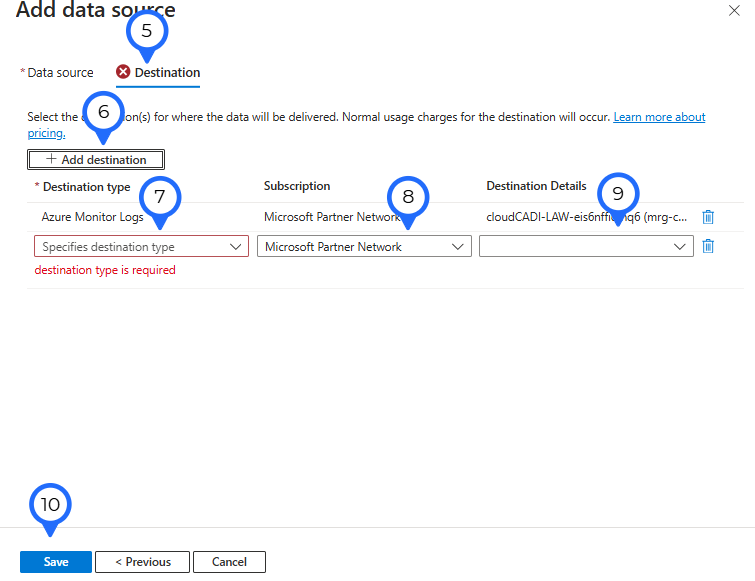
Step 5: Click on the "Destination".
Step 6: Click on "+Add destination".
Step 7: Choose the 'Destination type' as "Azure Monitor Logs".
Step 8: Choose the required 'Subscription'.
Step 9: Choose the required 'Log Analytics Workspace'.
Step 10: Click on "Save"
Setting Up App Service Monitoring
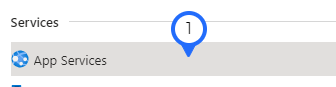
Step 1: Search for "App Service" in Azure Portal and select the required app service.
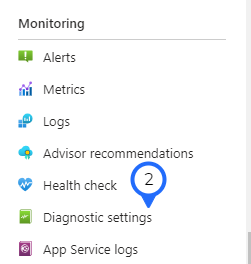
Step 2: Under monitoring, choose the "Diagnostic Setting".
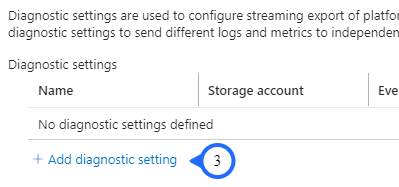
Step 3: Click “Add diagnostic setting”.
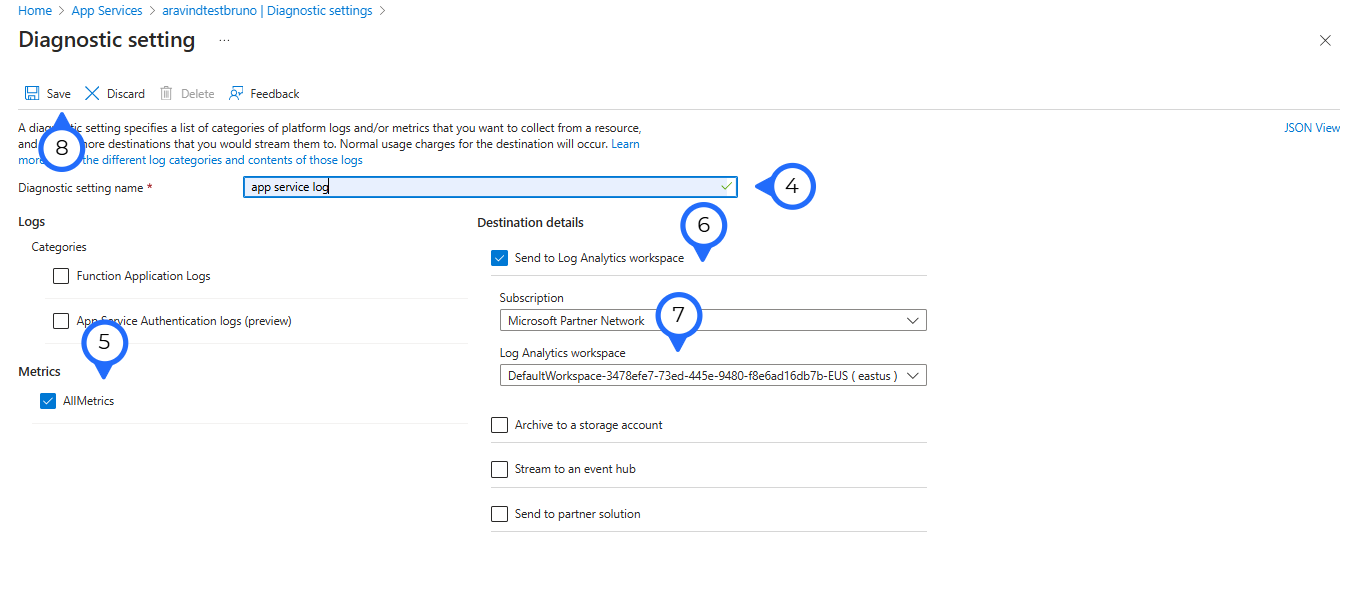
Step 4: Provide the diagnostic setting name.
Step 5: Enable all the metrics needed.
Step 6: Choose the destination to send to Log analytics workspace
Step 7: Select the previously configured Log analytics workspace from the list of available workspaces.
Step 8: Click "Save" to connect 'SQL Database' to the log analytics workspace.
Setting Up SQL Database Monitoring
Step 1: Search for "SQL Database" in 'Azure Portal' and select the required 'App service'.
Step 2: Under monitoring, choose the "Diagnostic Setting".
Step 3: Click “Add diagnostic setting”.
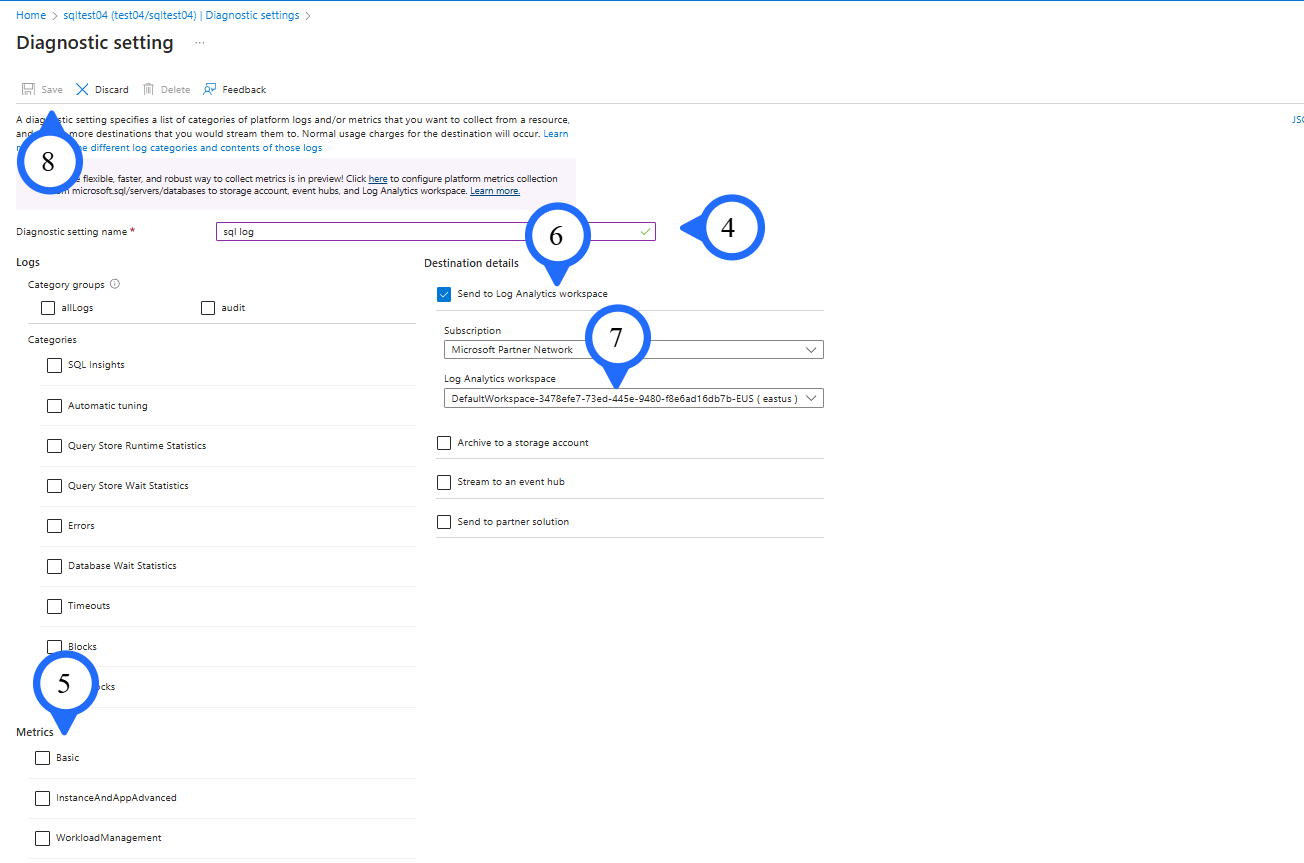
Step 4: Provide the diagnostic setting name.
Step 5: Enable all the metrics needed.
Step 6: Choose the destination to send to Log analytics workspace
Step 7: Select the previously configured 'Log analytics workspace' from the list of available workspaces.
Step 8: Click "Save" to connect 'SQL Database' to the log analytics workspace.